Risk-Return Assessments of OPE via SharpeRatio@k#
We describe the SharpeRatio@k metric for assessing the risk-return tradeoff of off-policy selection (OPS) results. Note that for the basic problem formulation of Off-Policy Evaluation and Selection (OPE/OPS), please also refer to Overview (OPE/OPS).
See also
The SharpeRatio@k metric is the main contribution of our paper “Towards Assessing and Benchmarking Risk-Return Tradeoff of Off-Policy Evaluation.” Our paper is currently under submission, and the arXiv version of the paper is available here.
Background#
While OPE is useful for estimating the policy performance of a new policy using offline logged data, OPE sometimes produces erroneous estimation due to counterfactual estimation and distribution shift between the behavior and evaluation policies. Therefore, in practical situations, we cannot solely rely on OPE results to choose the production policy, but instead, combine OPE results and online A/B tests for policy evaluation and selection [27]. Specifically, the practical workflow often begins by filtering out poor-performing policies based on OPE results, then conducting A/B tests on the remaining top-\(k\) policies to identify the best policy based on reliable online evaluation, as illustrated in the following figure.

Practical workflow of policy evaluation and selection
In the following sections, we consider this practical workflow and aim to evaluate the key properties of OPE estimators in selecting the top-k candidate policies for deployment in subsequent online A/B tests.
Issues of existing evaluation protocols of OPE/OPS#
To evaluate and compare the performance of OPE estimators, the following three metrics are often used:
Mean Squared Error (MSE) [25]: This metric measures the estimation accuracy of OPE esimator \(\hat{J}\).
Rank Correlation (RankCorr) [24, 26]: This metric measures how well the ranking of the candidate estimators is preserved in the OPE.
Regret @ \(k\) [29]: This metric measures how well the best policy among the top-\(k\) policies selected by an estimator performs. In particular, Regret@1 measures the performance difference between the true best policy and the best policy estimated by the OPE estimator.
In the above metrics, MSE measures the accuracy of OPE estimation, while the latter two assess the accuracy of downstream policy selection tasks. By combining these metrics, especially the latter two, we can quantify how likely an OPE estimator can choose a near-optimal policy in policy selection when solely relying on the OPE result. However, a critical shortcoming of the current evaluation protocol is that these metrics do not assess potential risks experienced during online A/B tests in more practical two-stage selection combined with online A/B tests. For instance, let us now consider the following situation as an illustrative example.

Example 1: overestimation vs. underestimation
In the above example, all three metrics report the same metric values for both estimators X and Y as follows.
(estimator) |
X |
Y |
MSE |
11.3 |
11.3 |
RankCorr |
0.413 |
0.413 |
Regret@3 |
0.0 |
0.0 |
However, since estimator X underestimates near-optimal policies and estimator Y overestimates poor-performing policies, there exists a non-negligible difference in their risk-return tradeoff. Unfortunately, all the existing metrics fail to detect the difference between estimators X and Y. This motivates the development of a new evaluation protocol that can quantify the risk-return tradeoff of OPE estimators.
Evaluating the top-\(k\) risk-return tradeoff in policy deployment#
Motivated by the lack of comprehensive risk-return assessment in OPE in existing literature, we propose a new evaluation metric called SharpeRatio@k. The key idea behind it is to regard the set of top-\(k\) candidate policies selected by an OPE estimator as its policy portfolio, drawing inspiration from risk-return assessments in finance. Specifically, we measure the risk, return, and efficiency of an OPE estimator using the following novel metric:
where best@ \(k(\hat{J})\) is the best policy performance among the top- \(k\) policies under estimator \(\hat{J}\) while std@ \(k(\hat{J})\) is the standard deviation of policy value among the top- \(k\) policies according to the estimator. They are more precisely defined as
where \(\Pi_k(\hat{J})\) is the top-\(k\) policies according to the estimated policy values under estimator \(\hat{J}\). Note that we include the behavior policy \(\pi_b\) as one of the candidate policies when computing SharpeRatio@k, and thus it is always non-negative and behaves differently given different \(\pi_b\).
Our SharpeRatio@k measures the return (best@ \(k\)) over the risk-free baseline (\(J(\pi_b)\)) while accounting for risk (std@ \(k\)) in the denominator. Reporting SharpeRatio@k under varying online evaluation budgets, i.e., different values of \(k\), is particularly useful to evaluate and understand the risk-return tradeoff of OPE estimators. Below, we showcase how SharpeRatio@k provides valuable insights for comparing OPE estimators in two practical scenarios while the current metrics fail to do so.
Example 1: Overestimation vs. Underestimation. The first case is the previously mentioned example of evaluating estimator X (which underestimates the near-best policy) and estimator Y (which overestimates the poor-performing policies) in the above figure. While the conventional metrics fail to distinguish the two estimators, SharpeRatio@k reports the following results:

SharpeRatio@k of example 1
As we can clearly see, SharpeRatio scores estimator X higher than Y. To understand the inner-workings of SharpeRatio@k, we also plot its numerator (return) and denominator (risk) separately in the figure. The decomposition of SharpeRatio@k shows that the return ( \(\text{best@}k (\hat{J}) - J(\pi_b)\)) is the same for both X and Y, while the risk ( \(\text{std@}k(\hat{J})\)) is substantially larger for estimator Y, since estimator Y overestimates the poor-performing policies and thus has the risk of deploying these detrimental policies during subsequent online A/B tests. Therefore, in terms of SharpeRatio@k, estimator X is preferable to Y, while the difference between the two estimators is overlooked by existing metrics.
Example 2: Conservative vs. High-Stakes. Another example involves evaluating a conservative OPE (estimator W, which always underestimates) and a uniform random OPE (estimator Z) as shown in the following figure.

Example 2: conservative vs. high-stakes
In this case, the typical metrics again give W and Z almost the same values, making it difficult to decide which estimator to use in practical situations.
(estimator) |
W |
Z |
MSE |
60.1 |
58.6 |
RankCorr |
0.079 |
0.023 |
Regret@1 |
9.0 |
9.0 |
In contrast, our top-\(k\) RRT metrics report the following results, which clearly distinguish the two estimators taking the problem instance ( \(V(\pi_b)\)) into account:

SharpeRatio@k of example 2
The figure compares two estimators under three different behavior policies with varying effectiveness (\(J(\pi_b)=5.0, 10, 15\); higher values indicate greater effectiveness of the behavior policy \(\pi_b\)). The figure shows, when \(\pi_b\) performs poorly (i.e., \(J(\pi_b)=5.0\)), SharpeRatio@k determines that estimator W is the better choice. In contrast, when \(\pi_b\) exhibits moderate performance ( \(J(\pi_b)=10\)), SharpeRatio@k displays no preference between the two estimators, signifying no efficiency difference in this scenario. Finally, when \(\pi_b\) already demonstrates strong performance ( \(J(\pi_b)=15\)), estimator Y emerges as the more efficient option according to SharpeRatio@k. As shown here, SharpeRatio@k effectively provides valuable guidance on selecting the most appropriate estimator based on their efficiency, proving to be a more informative metric than existing “accuracy” metrics.
OPE benchmarks with SharpeRatio@k#
We conduct OPE benchmark using four continuous control benchmarks including Reacher, InvertedPendulum, Hopper, and Swimmer from Gym-Mujoco [31] and discrete controls such as CartPole, MountainCar, and Acrobot from Gym-Classic Control [31]. For the detailed settings, please refer to Section 4.1 of our paper.
Result 1: SharpeRatio report the performance of OPE estimators differently from conventional metrics.

(Left) Comparison of SharpeRatio@4 and conventional metrics (RankCorr, nRegret, nMSE) in assessing OPE estimators. (Right) The number of trials in which the best estimator, selected by SharpeRatio@4 (SR@4) and conventional metrics, aligns. Both figures report the results of 70 trials, consisting of 7 tasks and 10 random seeds for each. A lower value is better for nMSE and nRegret, while a higher value is better for RankCorr and SharpeRatio@4.
The left figure illustrates the correlation and divergence between SharpeRatio@4 and conventional metrics in evaluating OPE estimators across various RL tasks. Each point in the figure represents the metrics for five estimators over 70 trials, consisting of 7 different tasks and 10 random seeds. The right figure presents the number of trials where the best estimators, as identified by SharpeRatio@4 and each conventional metric, coincide.
The above figures reveal that superior conventional metric values (i.e., higher RankCorr and lower nRegret and nMSE) do not consistently correspond to higher SharpeRatio@4 values. The most significant deviation of SharpeRatio@4 is from nMSE, which is understandable given that nMSE focuses solely on the estimation accuracy of OPE without considering policy selection effectiveness. In contrast, SharpeRatio@4 shows some correlation with policy selection metrics (RankCorr and nRegret). Nonetheless, the best estimator chosen by SharpeRatio@4 often differs from those selected by RankCorr and nRegret. SharpeRatio@4 and nRegret align in only 8 of the 70 trials, and RankCorr, despite being the most closely correlated metric with SharpeRatio, diverges in the choice of the estimator in over 40% of the trials (29 out of 70).
The following sections explore specific instances where SharpeRatio@k and conventional metrics diverge, demonstrating how SharpeRatio@k effectively validates the risk-return trade-off, while conventional metrics fall short.
Result 2: SharpeRatio@k is more appropriate and informative than conventional accuracy metrics.
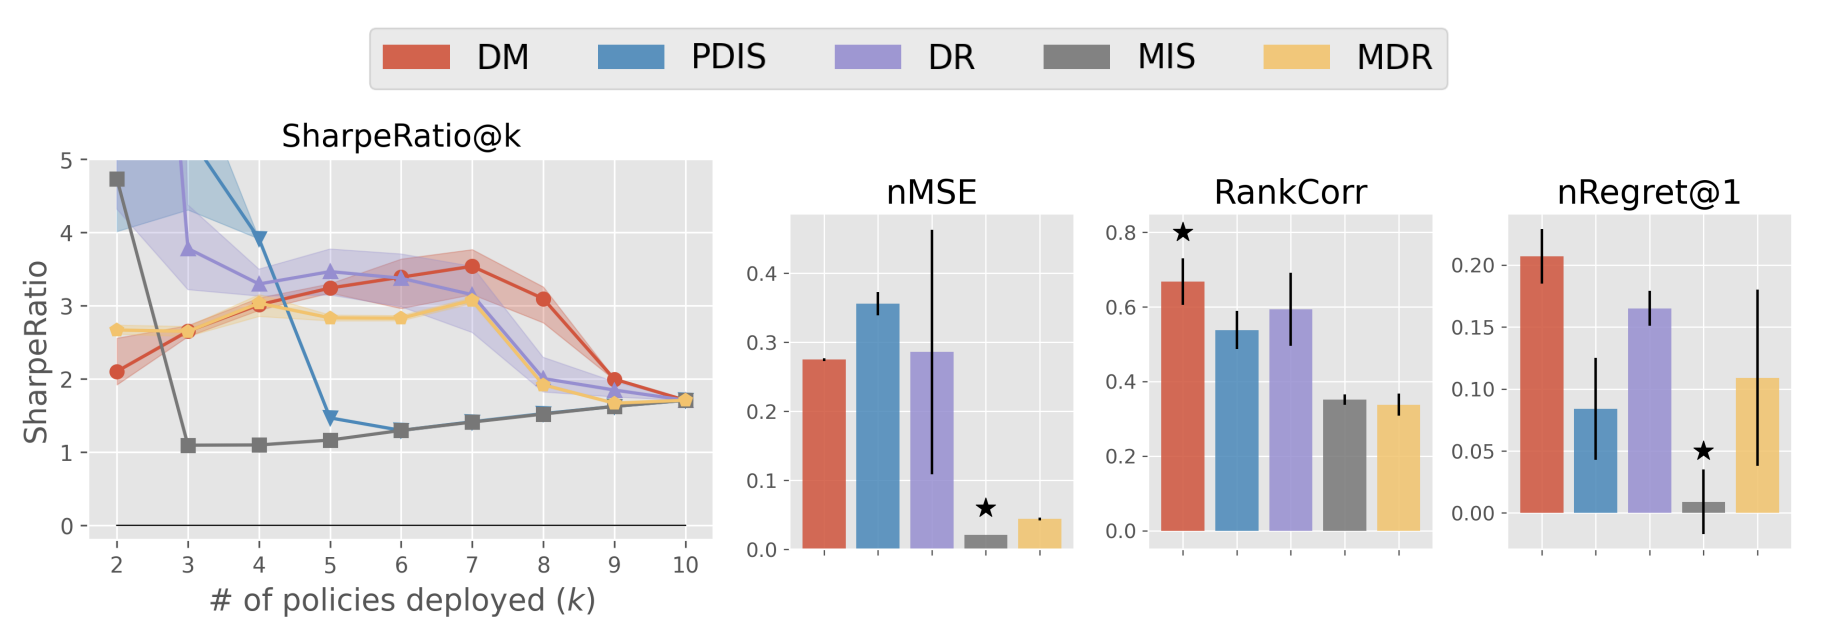
Result 2-1: Estimators’ performance comparison based on SharpeRatio@k (the left figure) and conventional metrics including nMSE, RankCorr, and nRegret@1 (the right three figures) in MounrainCar. A lower value is better for nMSE and nRegret@1, while a higher value is better for RankCorr and SharpeRatio@k. The stars ( \(\star\)) indicate the best estimator(s) under each metric.
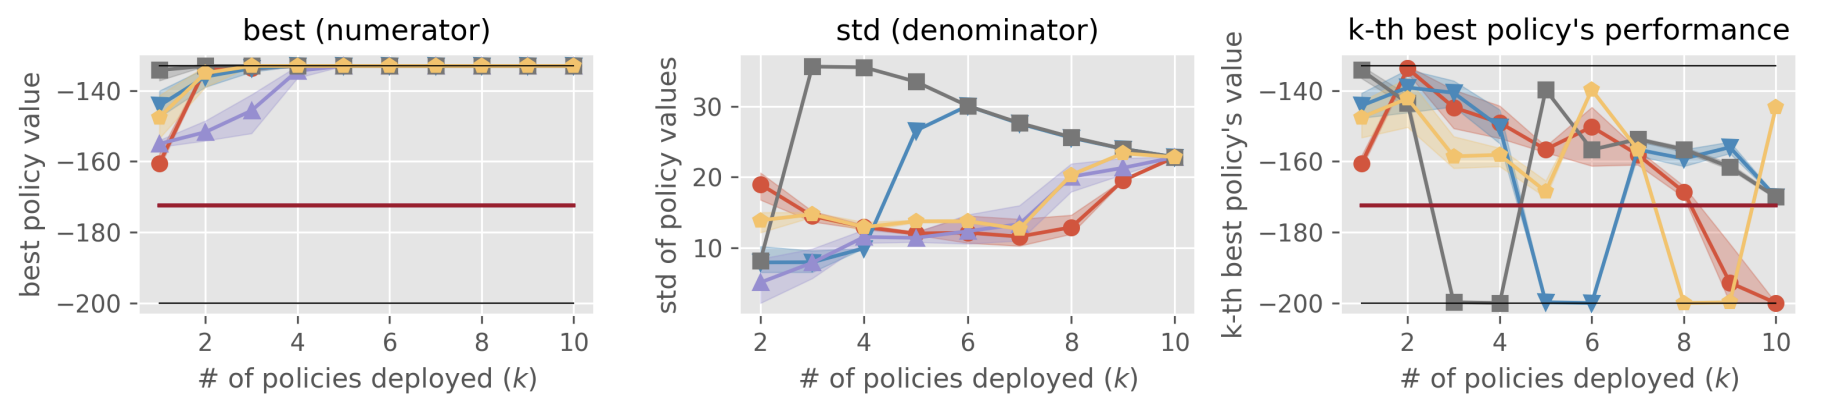
Result 2-2: Reference statistics of the top- \(k\) policy portfolio formed by each estimator in MounrainCar “best” is used as the numerator of SharpeRatio@k, while “std” is used as its denominator. A higher value is better for “best” and ” \(k\)-th best policy’s performance”, while a lower value is better for “std”. The dark red lines show the performance of \(\pi_b\), which is the risk-free baseline of SharpeRatio@k.
The top figure (Result 2-1) contrasts the benchmark results obtained using SharpeRatio@k with those derived from conventional metrics in the MountainCar task. The bottom figure (Result 2-2) details reference statistics for the top-\(k\) policy portfolios created by each estimator. Notably, the “\(k\)-th best policy’s performance” indicates how well the policy, ranked \(k\)-th by each estimator, performs.
These results highlight that the preferred OPE estimator varies significantly based on the evaluation metrics used. For instance, MSE and Regret favor MIS as the best estimator, while Rankcorr and SharpeRatio@7 select DM, and SharpeRatio@4 opts for PDIS. Upon examining these three estimators through the reference statistics in the bottom figure (Result 2-2), it becomes evident that conventional metrics tend to overlook the risk associated with OPE estimators including suboptimal policies in their portfolio. Specifically, nMSE and nRegret fail to recognize the danger of MIS implementing an almost worst-case estimator for \(k \leq 4\). Additionally, RankCorr does not acknowledge the risk involved with PDIS implementing a nearly worst-case estimator for \(k \leq 6\), and it inappropriately ranks PDIS higher than MDR, which avoids deploying a suboptimal policy until the last deployment (\(k=9, 10\)).
In contrast, SharpeRatio@k effectively discerns the varied characteristics of policy portfolios and adeptly identifies a safe and efficient estimator that is adaptable to the specific budget (\(k\)) or problem instance (\(J(\pi_b)\)).
Overall, the benchmark findings suggest that SharpeRatio@k offers a more pragmatically meaningful comparison of OPE estimators than existing accuracy metrics.
Result 3: Comprehensive results and suggested future works
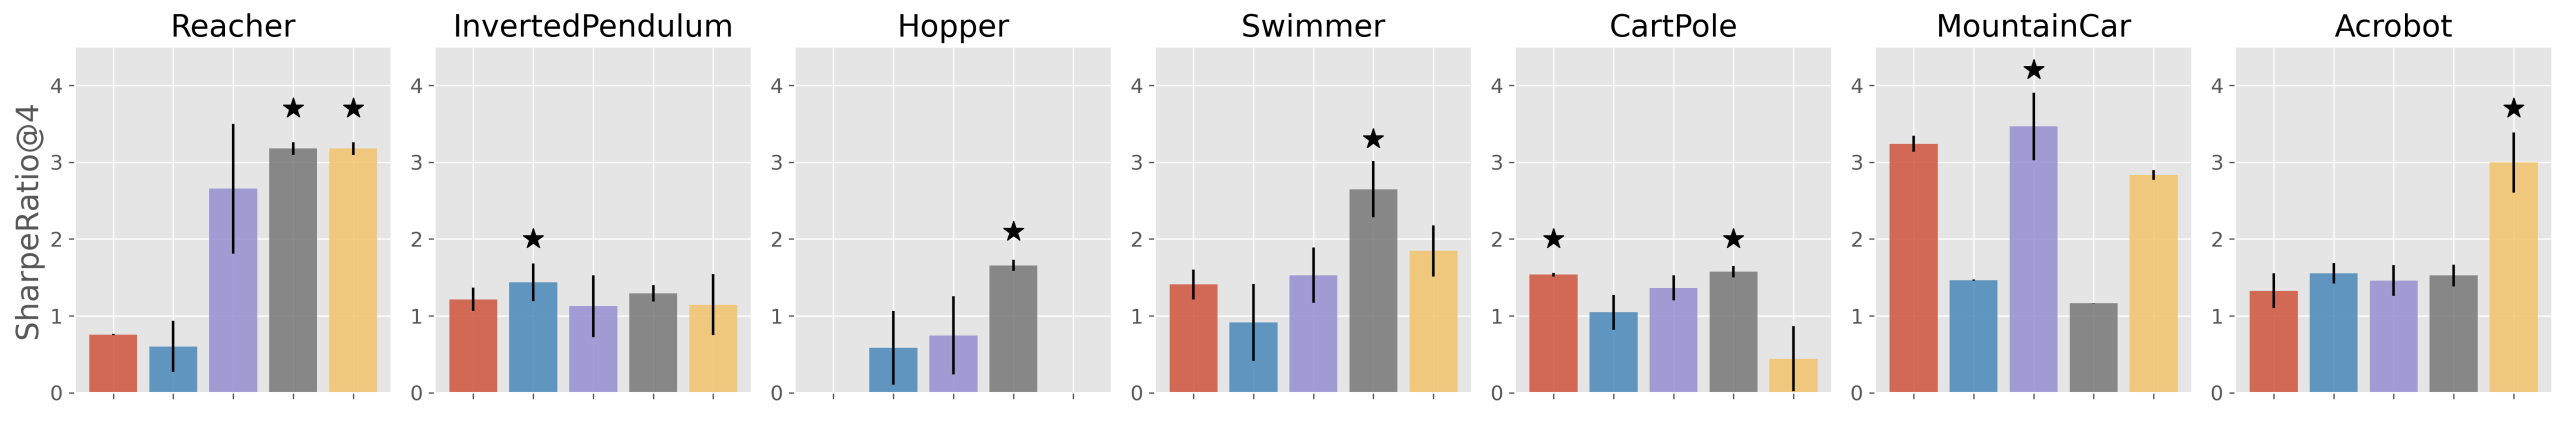
Benchmark results with SharpeRatio@4. The star ( \(\star\)) indicates the best estimator(s).
The above figure reports the benchmark results of OPE estimators with SharpeRatio@4 in various RL environments, providing the following directions and suggestions for future OPE research.
Future research in OPE should include the assessment of estimators based on SharpeRatio@k:
The findings from the previous section suggest that SharpeRatio@k provides more actionable insights compared to traditional accuracy metrics. The benchmark results using SharpeRatio@k (particularly as shown in the figures of Result 2), often significantly differ from those obtained with conventional accuracy metrics. This highlights the importance of integrating SharpeRatio@k into future research to more effectively evaluate the efficiency of OPE estimators.
A new estimator that explicitly optimizes the risk-return tradeoff:
While DR and MDR are generally regarded as advanced in existing literature, they do not consistently outperform DM, PDIS, and MIS according to SharpeRatio@k, as indicated in the figure. This is attributable to their lack of specific design for optimizing the risk-return tradeoff and efficiency. Consequently, a promising research avenue would be to create a new estimator that explicitly focuses more on optimizing this risk-return tradeoff than existing methods.
A data-driven estimator selection method:
The results show that the most efficient estimator varies significantly across different environments, underscoring the need for adaptively selecting the most suitable estimator for reliable OPE. Given that existing estimator selection methods predominantly focus on “accuracy’’ metrics like MSE and Regret, there is an intriguing opportunity for future research to develop a novel estimator selection method that considers risks and efficiency.
See also
More results and discussions are available in Appendix of our research paper.
Citation#
If you use the proposed metric (SharpeRatio@k) or refer to our findings in your work, please cite our paper below.
@article{kiyohara2023towards,
    title={Towards Assessing and Benchmarking Risk-Return Tradeoff of Off-Policy Evaluation},
    author={Kiyohara, Haruka and Kishimoto, Ren and Kawakami, Kosuke and Kobayashi, Ken and Nakata, Kazuhide and Saito, Yuta},
    journal={arXiv preprint arXiv:2311.18207},
    year={2023}
}