Risk-Return Assessments of OPE via SharpeRatio@k#
We describe the SharpeRatio@k metric for assessing the risk-return tradeoff of off-policy selection (OPS) results. Note that for the basic problem formulation of Off-Policy Evaluation and Selection (OPE/OPS), please also refer to Overview (OPE/OPS).
See also
The SharpeRatio@k metric is the main contribution of our paper “Towards Assessing and Benchmarking Risk-Return Tradeoff of Off-Policy Evaluation in Reinforcement Learning.” Our paper is currently under submission, and the arXiv version of the paper will come soon..
Background#
While OPE is useful for estimating the policy performance of a new policy using offline logged data, OPE sometimes produces erroneous estimation due to counterfactual estimation and distribution shift between the behavior and evaluation policies. Therefore, in practical situations, we cannot solely rely on OPE results to choose the production policy, but instead, combine OPE results and online A/B tests for policy evaluation and selection [27]. Specifically, the practical workflow often begins by filtering out poor-performing policies based on OPE results, then conducting A/B tests on the remaining top-\(k\) policies to identify the best policy based on reliable online evaluation, as illustrated in the following figure.

Practical workflow of policy evaluation and selection
In the following sections, we consider this practical workflow and aim to evaluate the key properties of OPE estimators in selecting the top-k candidate policies for deployment in subsequent online A/B tests.
Issues of existing evaluation protocols of OPE/OPS#
To evaluate and compare the performance of OPE estimators, the following three metrics are often used:
Mean Squared Error (MSE) [25]: This metric measures the estimation accuracy of OPE esimator \(\hat{J}\).
Rank Correlation (RankCorr) [24, 26]: This metric measures how well the ranking of the candidate estimators is preserved in the OPE.
Regret @ \(k\) [29]: This metric measures how well the best policy among the top-\(k\) policies selected by an estimator performs. In particular, Regret@1 measures the performance difference between the true best policy and the best policy estimated by the OPE estimator.
In the above metrics, MSE measures the accuracy of OPE estimation, while the latter two assess the accuracy of downstream policy selection tasks. By combining these metrics, especially the latter two, we can quantify how likely an OPE estimator can choose a near-optimal policy in policy selection when solely relying on the OPE result. However, a critical shortcoming of the current evaluation protocol is that these metrics do not assess potential risks experienced during online A/B tests in more practical two-stage selection combined with online A/B tests. For instance, let us now consider the following toy situation as an illustrative example.
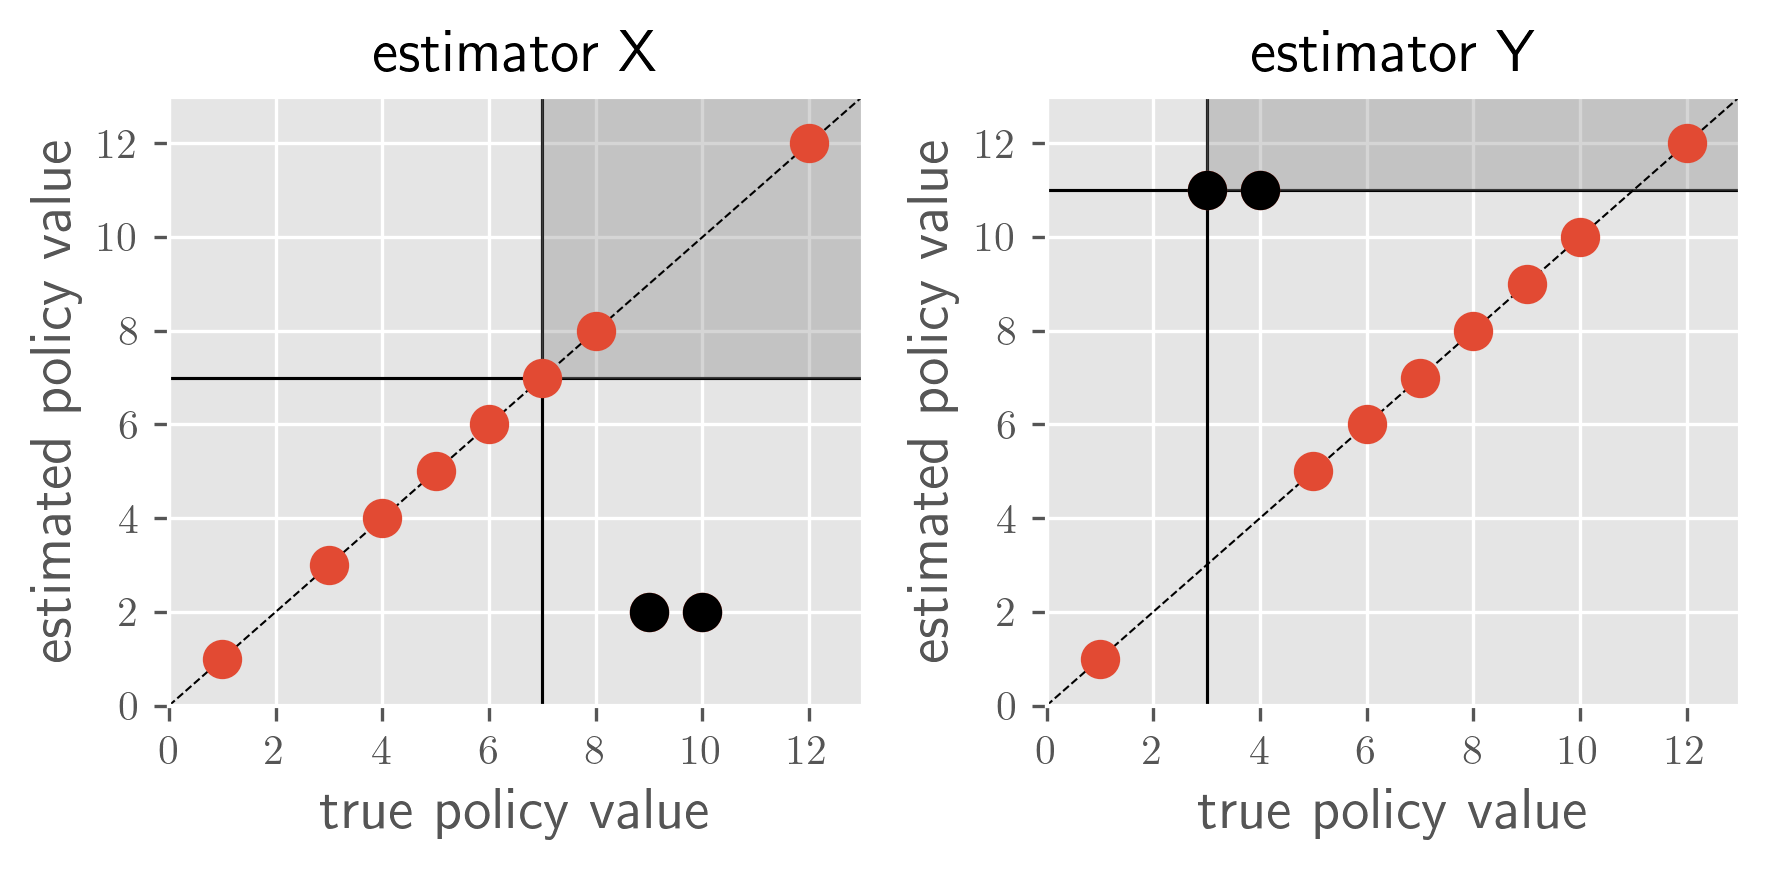
Toy example 1: overestimation vs. underestimation
In the above example, all three metrics report the same metric values for both estimators X and Y as follows.
(estimator) |
X |
Y |
MSE |
11.3 |
11.3 |
RankCorr |
0.413 |
0.413 |
Regret@3 |
0.0 |
0.0 |
However, since estimator X underestimates near-optimal policies and estimator Y overestimates poor-performing policies, there exists a non-negligible difference in their risk-return tradeoff. Unfortunately, all the existing metrics fail to detect the difference between estimators X and Y. This motivates the development of a new evaluation protocol that can quantify the risk-return tradeoff of OPE estimators.
Evaluating the top-\(k\) risk-return tradeoff in policy deployment#
Motivated by the lack of comprehensive risk-return assessment in OPE in existing literature, we propose a new evaluation metric called SharpeRatio@k. The key idea behind it is to regard the set of top-\(k\) candidate policies selected by an OPE estimator as its policy portfolio, drawing inspiration from risk-return assessments in finance. Specifically, we measure the risk, return, and efficiency of an OPE estimator using the following novel metric:
where best@ \(k(\hat{J})\) is the best policy performance among the top- \(k\) policies under estimator \(\hat{J}\) while std@ \(k(\hat{J})\) is the standard deviation of policy value among the top- \(k\) policies according to the estimator. They are more precisely defined as
where \(\Pi_k(\hat{J})\) is the top-\(k\) policies according to the estimated policy values under estimator \(\hat{J}\). Note that we include the behavior policy \(\pi_b\) as one of the candidate policies when computing SharpeRatio@k, and thus it is always non-negative and behaves differently given different \(\pi_b\).
Our SharpeRatio@k measures the return (best@ \(k\)) over the risk-free baseline (\(J(\pi_b)\)) while accounting for risk (std@ \(k\)) in the denominator. Reporting SharpeRatio@k under varying online evaluation budgets, i.e., different values of \(k\), is particularly useful to evaluate and understand the risk-return tradeoff of OPE estimators. Below, we showcase how SharpeRatio@k provides valuable insights for comparing OPE estimators in two practical scenarios while the current metrics fail to do so.
Toy example 1: Overestimation vs. Underestimation. The first case is the previously mentioned example of evaluating estimator X (which underestimates the near-best policy) and estimator Y (which overestimates the poor-performing policies) in the above figure. While the conventional metrics fail to distinguish the two estimators, SharpeRatio@k reports the following results:
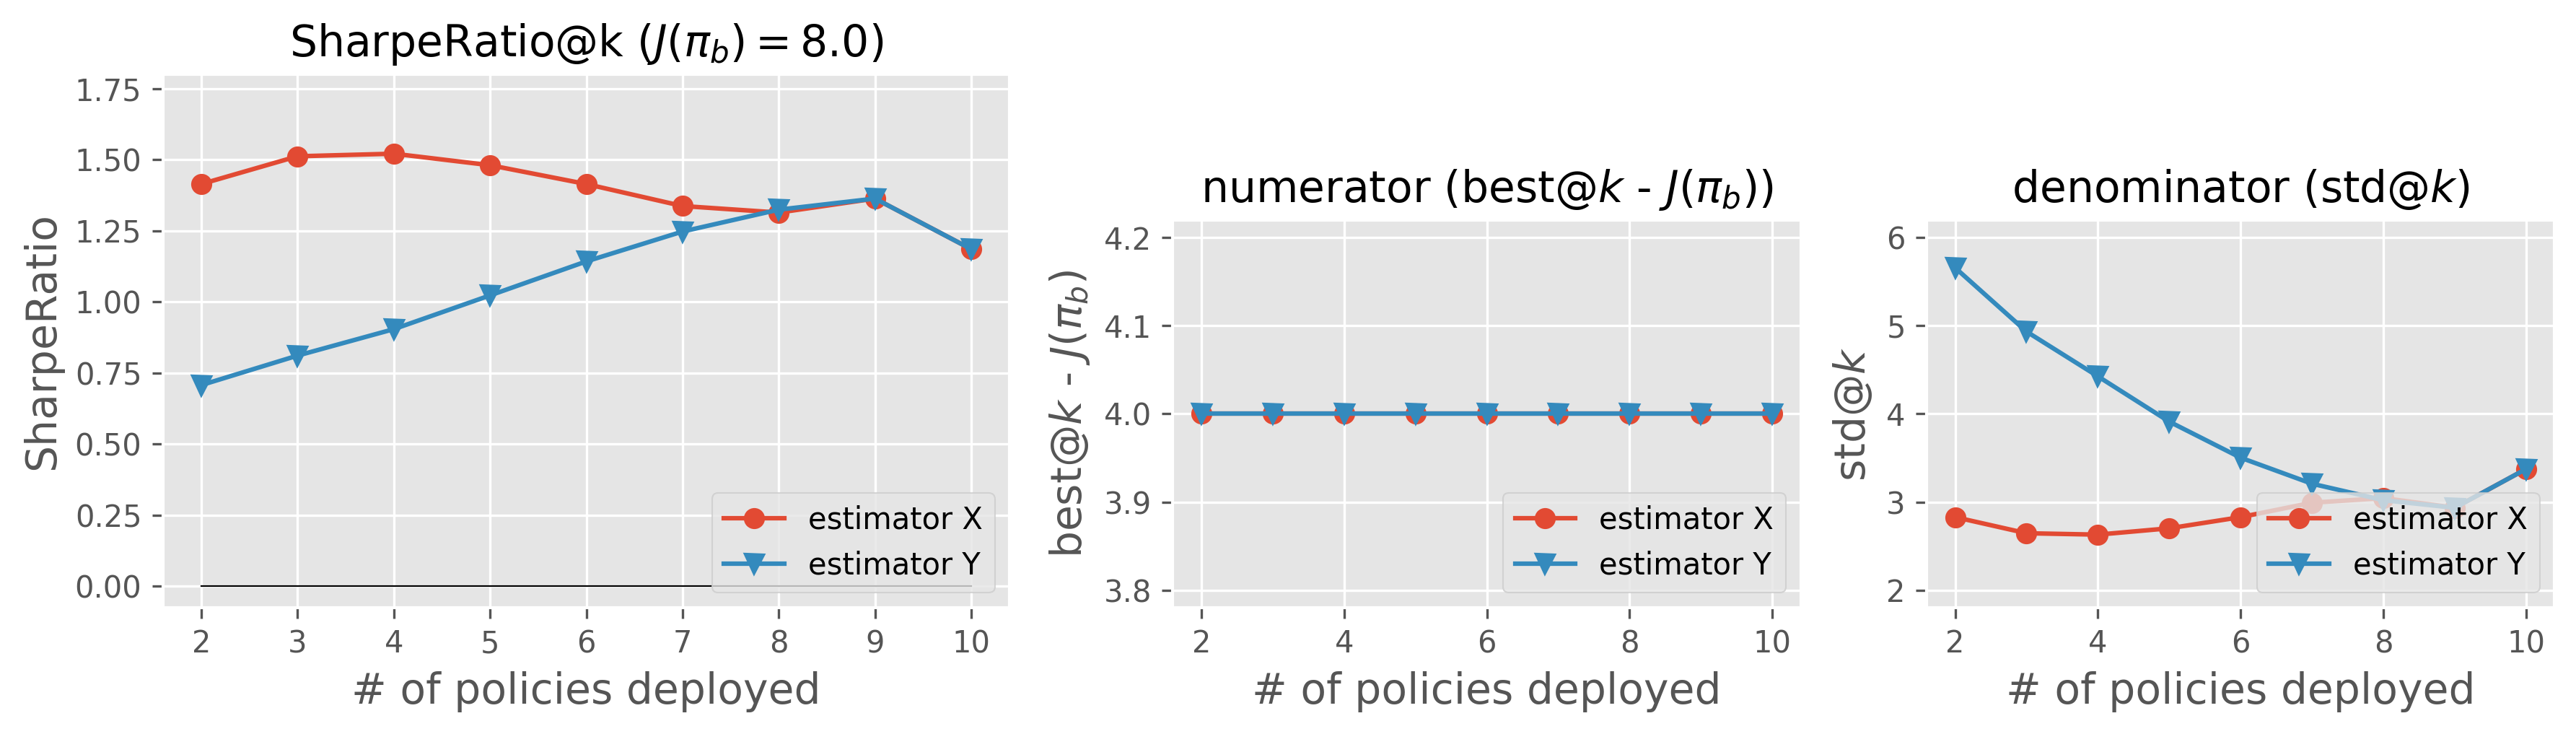
SharpeRatio@k of the toy example 1
As we can clearly see, SharpeRatio scores estimator X higher than Y. To understand the inner-workings of SharpeRatio@k, we also plot its numerator (return) and denominator (risk) separately in the figure. The decomposition of SharpeRatio@k shows that the return ( \(\text{best@}k (\hat{J}) - J(\pi_b)\)) is the same for both X and Y, while the risk ( \(\text{std@}k(\hat{J})\)) is substantially larger for estimator Y, since estimator Y overestimates the poor-performing policies and thus has the risk of deploying these detrimental policies during subsequent online A/B tests. Therefore, in terms of SharpeRatio@k, estimator X is preferable to Y, while the difference between the two estimators is overlooked by existing metrics.
Toy example 2: Conservative vs. High-Stakes. Another example involves evaluating a conservative OPE (estimator W, which always underestimates) and a uniform random OPE (estimator Z) as shown in the following figure.
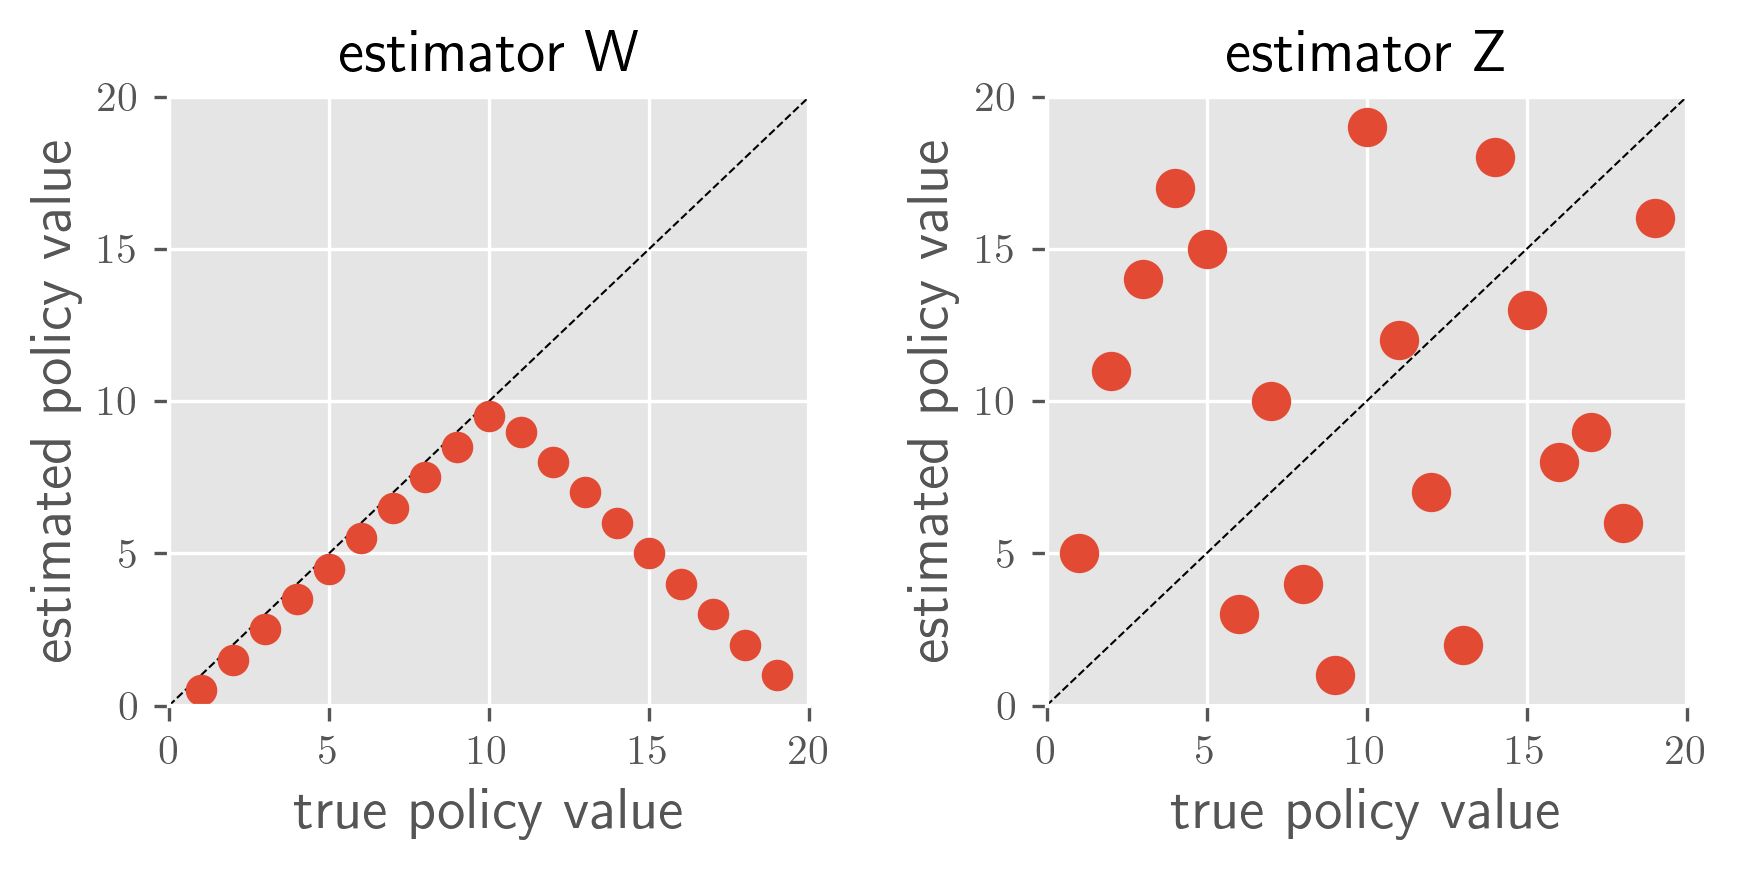
Toy example 2: conservative vs. high-stakes
In this case, the typical metrics again give W and Z almost the same values, making it difficult to decide which estimator to use in practical situations.
(estimator) |
W |
Z |
MSE |
60.1 |
58.6 |
RankCorr |
0.079 |
0.023 |
Regret@1 |
9.0 |
9.0 |
In contrast, our top-\(k\) RRT metrics report the following results, which clearly distinguish the two estimators taking the problem instance ( \(V(\pi_b)\)) into account:

SharpeRatio@k the toy example 2
The figure compares two estimators under three different behavior policies with varying effectiveness (\(J(\pi_b)=5.0, 10, 15\); higher values indicate greater effectiveness of the behavior policy \(\pi_b\)). The figure shows, when \(\pi_b\) performs poorly (i.e., \(J(\pi_b)=5.0\)), SharpeRatio@k determines that estimator W is the better choice. In contrast, when \(\pi_b\) exhibits moderate performance ( \(J(\pi_b)=10\)), SharpeRatio@k displays no preference between the two estimators, signifying no efficiency difference in this scenario. Finally, when \(\pi_b\) already demonstrates strong performance ( \(J(\pi_b)=15\)), estimator Y emerges as the more efficient option according to SharpeRatio@k. As shown here, SharpeRatio@k effectively provides valuable guidance on selecting the most appropriate estimator based on their efficiency, proving to be a more informative metric than existing “accuracy” metrics.
OPE benchmarks with SharpeRatio@k#
We conduct OPE benchmark using four continuous control benchmarks including Reacher, InvertedPendulum, Hopper, and Swimmer from Gym-Mujoco [31] and discrete controls such as CartPole, MountainCar, and Acrobot from Gym-Classic Control [31]. For the detailed settings, please refer to Section 4.1 of our paper.
Result 1: SharpeRatio@k is more appropriate and informative than conventional accuracy metrics.
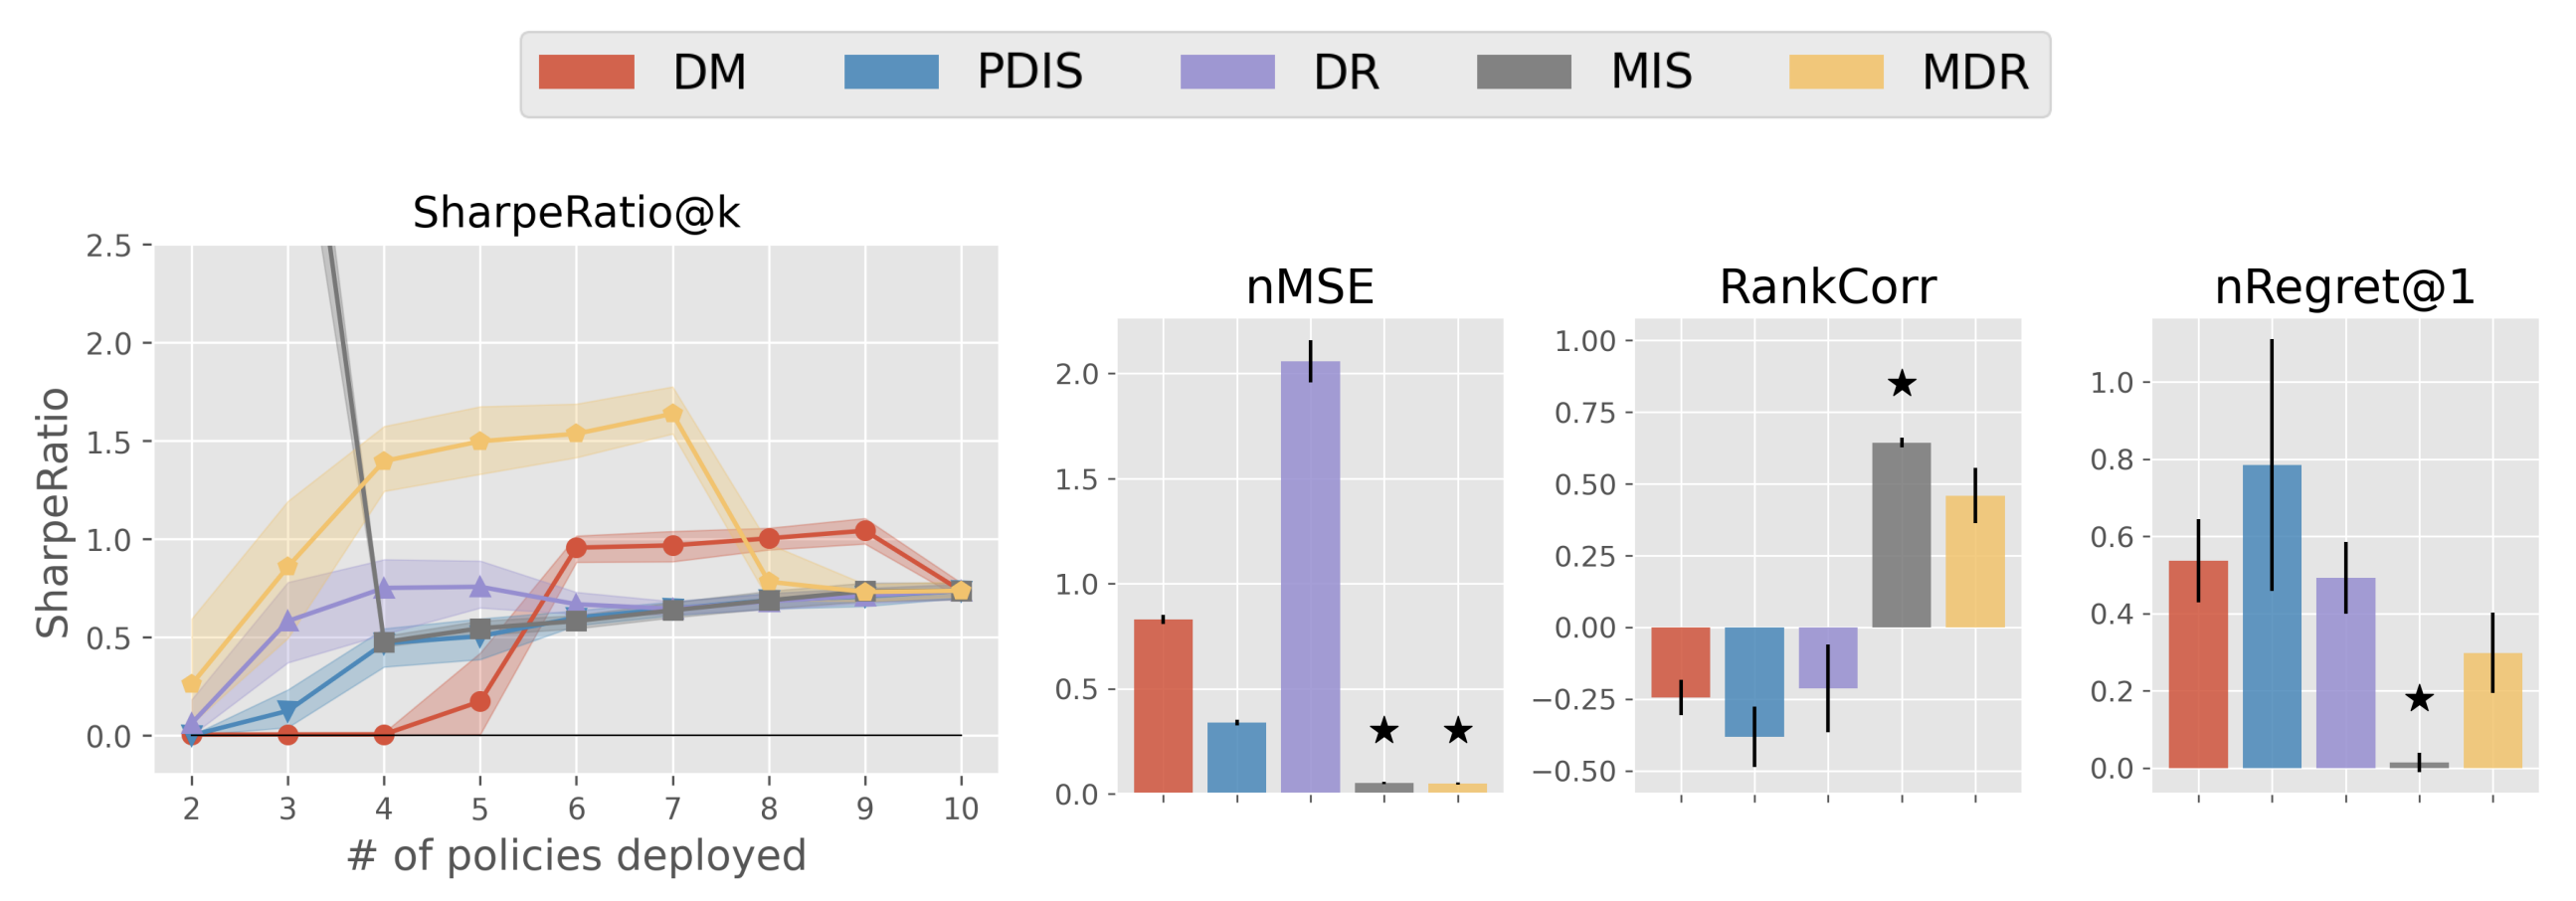
Result 1-1: Estimators’ performance comparison based on SharpeRatio@k (the left figure) and conventional metrics including nMSE, RankCorr, and nRegret@1 (the right three figures) in Acrobot. A lower value is better for nMSE and nRegret@1, while a higher value is better for RankCorr and SharpeRatio@k. The stars ( \(\star\)) indicate the best estimator(s) under each metric.
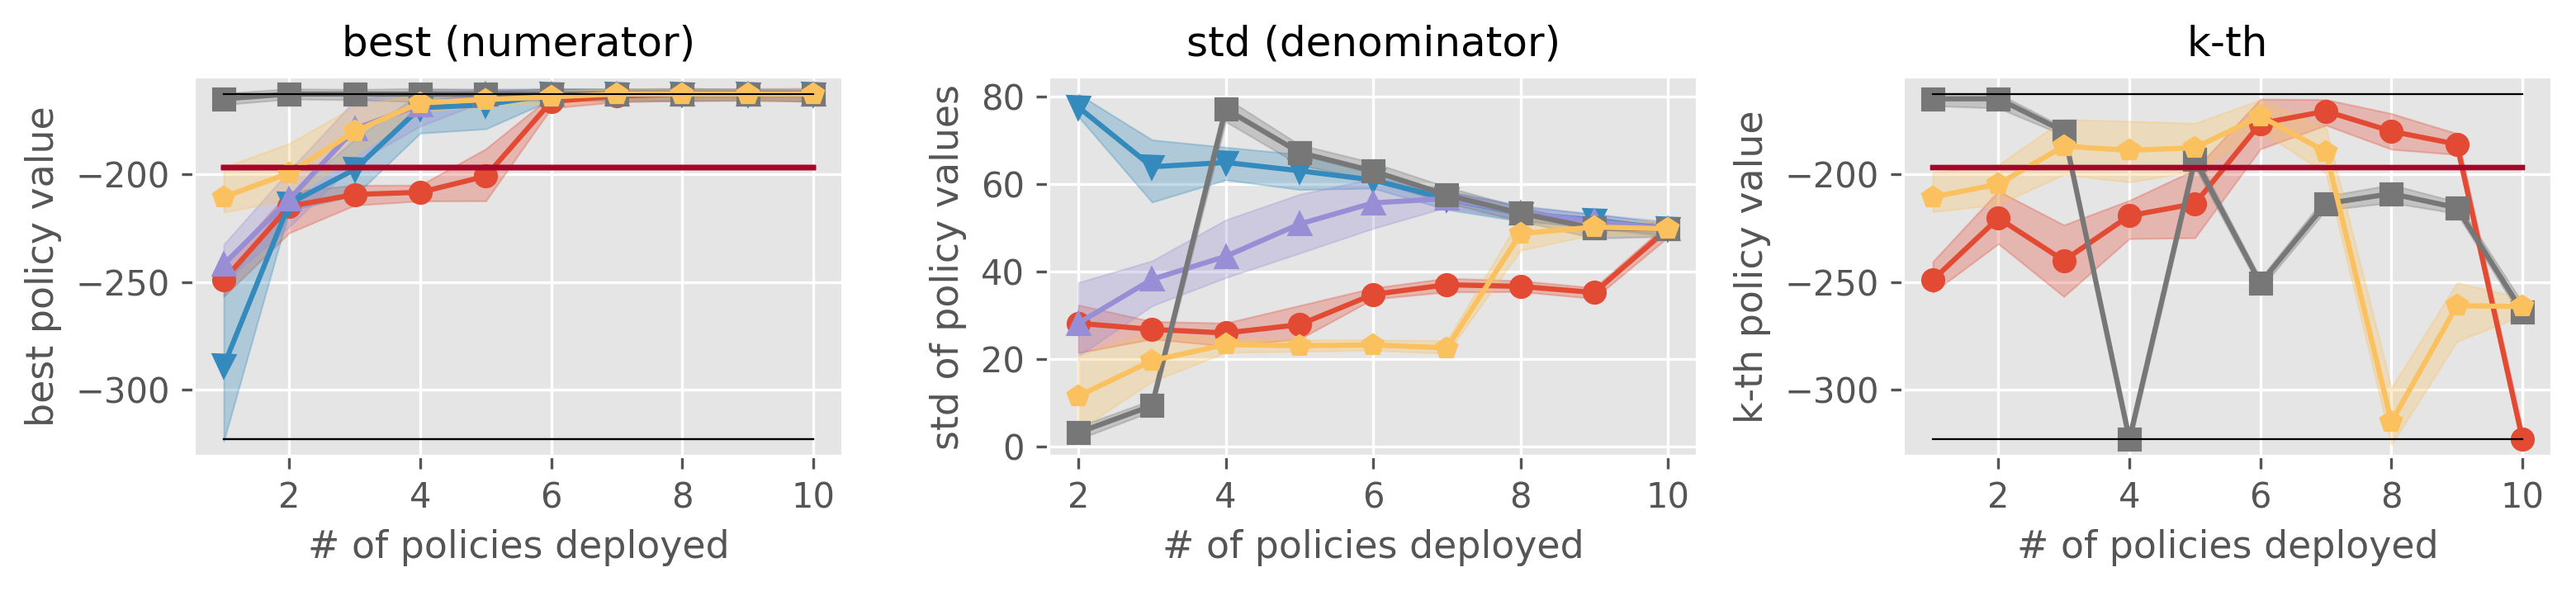
Result 1-2: Reference statistics of the top- \(k\) policy portfolio formed by each estimator in Acrobot “best” is used as the numerator of SharpeRatio@k, while “std” is used as its denominator. A higher value is better for “best” and ” \(k\)-th best policy’s performance”, while a lower value is better for “std”. The dark red lines show the performance of \(\pi_b\), which is the risk-free baseline of SharpeRatio@k.
The above figure (Result 1-1.) presents a comparison between the benchmark results under SharpeRatio@k and those under conventional metrics in Acrobot. The next figure (Result 1-2.) reports some reference statistics about the top- \(k\) policy portfolios formed by each estimator, where ” \(k\)-th best policy’s performance” shows the performance of the policy ranked \(k\)-th among the candidates by each estimator.
First, Result 1-1. shows that both conventional metrics and SharpeRatio@k acknowledge the advantage of MDR, which is ranked the best in SharpeRatio@k ( \(4 \leq k \leq 8\)) and the second-best according to conventional metrics. In contrast, there exists a substantial difference in the evaluation of MIS and DM between SharpeRatio@k and the other metrics. This discrepancy arises because, as shown in ” \(k\)-th best policy’s performance” of Result 1-2, MIS overestimates one of the worst policies, even though it ranks the other policies in a nearly perfect order (which parallels that of estimator Y in the toy example 2). Thus, conventional metrics evaluate MIS as the most “accurate” estimator, neglecting the evident risk of implementing a detrimental policy. On the other hand, SharpeRatio@k successfully detects this risky conduct of MIS by taking “std” (risk metric) into account, gives more preference to MDR and DM for \(k \ge 4\), as they perform safer than MIS.
It is worth noticing that SharpeRatio@k evaluates DM as the best estimator when \(k \geq 6\), whereas it is among the worst estimators under conventional metrics. This contrast can be attributed to DM’s weakness in accurately ranking the top candidate policies. As we can see in ” \(k\)-th best policy’s performance” of Result 1-2, DM is also able to avoid selecting the worse policy until the very last ( \(k=10\)) in this environment. SharpeRatio@k captures this particular characteristic of DM and precisely evaluates its risk-return tradeoffs with varying online evaluation budgets ( \(k\)), while existing accuracy metrics fail to do so.
Overall, the benchmark results suggest that SharpeRatio@k provides a more practically meaningful comparison of OPE estimators than conventional accuracy metrics.
Result 2: Comprehensive results and suggested future works
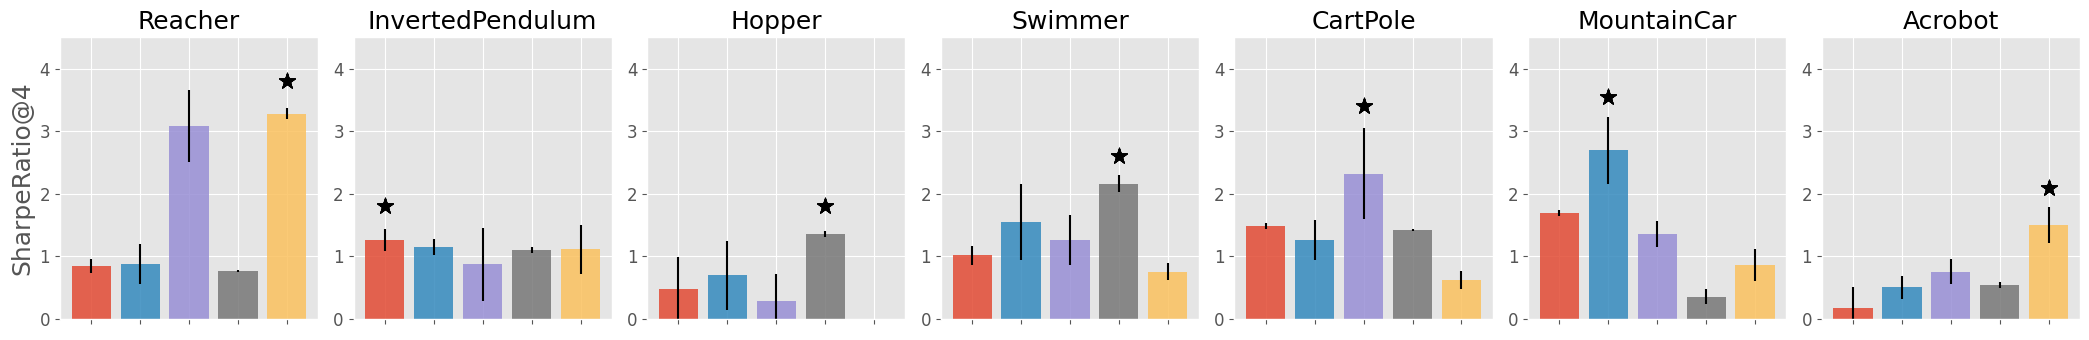
Benchmark results with SharpeRatio@4. The star ( \(\star\)) indicates the best estimator(s).
The above figure reports the benchmark results of the OPE estimators with SharpeRatio@4 in various benchmark environments, providing the following directions and suggestions for future OPE research.
Future research in OPE should include assessments of estimators under SharpeRatio@k:
We observe in the previous Acrobot case that SharpeRatio@k offers more practical insights than conventional accuracy metrics, and the benchmark results under SharpeRatio@k sometimes diverge substantially from those under conventional accuracy metrics (See our paper for the details). This indicates that future research should, at least additionally, employ SharpeRatio@k to assess OPE estimators in their experiments.
A new estimator that explicitly optimizes the risk-return tradeoff:
Even though DR and MDR are generally considered more sophisticated in existing research, they do not always outperform DM, PDIS, and MIS under SharpeRatio@k in the above figure. This is because they are not specifically designed to enhance the risk-return tradeoff and associated efficiency. Therefore, it would be a valuable direction to develop a novel estimator that more explicitly optimizes the risk-return tradeoff than existing methods.
A data-driven estimator selection method:
The results demonstrate that the most efficient estimator can change greatly across environments, suggesting that adaptively selecting an appropriate estimator is critical for a reliable OPE in practice. Since existing methods in estimator selection mostly focus on the “accuracy” metrics such as MSE and Regret, developing a novel estimator selection method that can account for risks and efficiency would also be an interesting direction for future studies.
See also
More results and discussions are available in our research paper.
Citation#
If you use the proposed metric (SharpeRatio@k) or refer to our findings in your work, please cite our paper below.
@article{kiyohara2023towards,
    title={Towards Assessing and Benchmarking Risk-Return Tradeoff of Off-Policy Evaluation in Reinforcement Learning},
    author={Kiyohara, Haruka and Kishimoto, Ren and Kawakami, Kosuke and Kobayashi, Ken and Nakata, Kazuhide and Saito, Yuta},
    journal={arXiv preprint arXiv:23xx.xxxxx},
    year={2023}
}